
Reporting on Engagement for Managers
Engagement surveys provide valuable feedback from your employees and include reporting tools that help you analyze survey results and identify engagement trends.
Note: To learn how to create a custom engagement survey, see the article on setting up custom surveys.
Who Can View the Results?
Only the user who initiates an engagement survey can view its results.
At this time, there is no option to share engagement survey results with other users within your Perform account.
Getting Started
To view the results of an engagement survey:
-
From the left navigation menu, click Engagement.
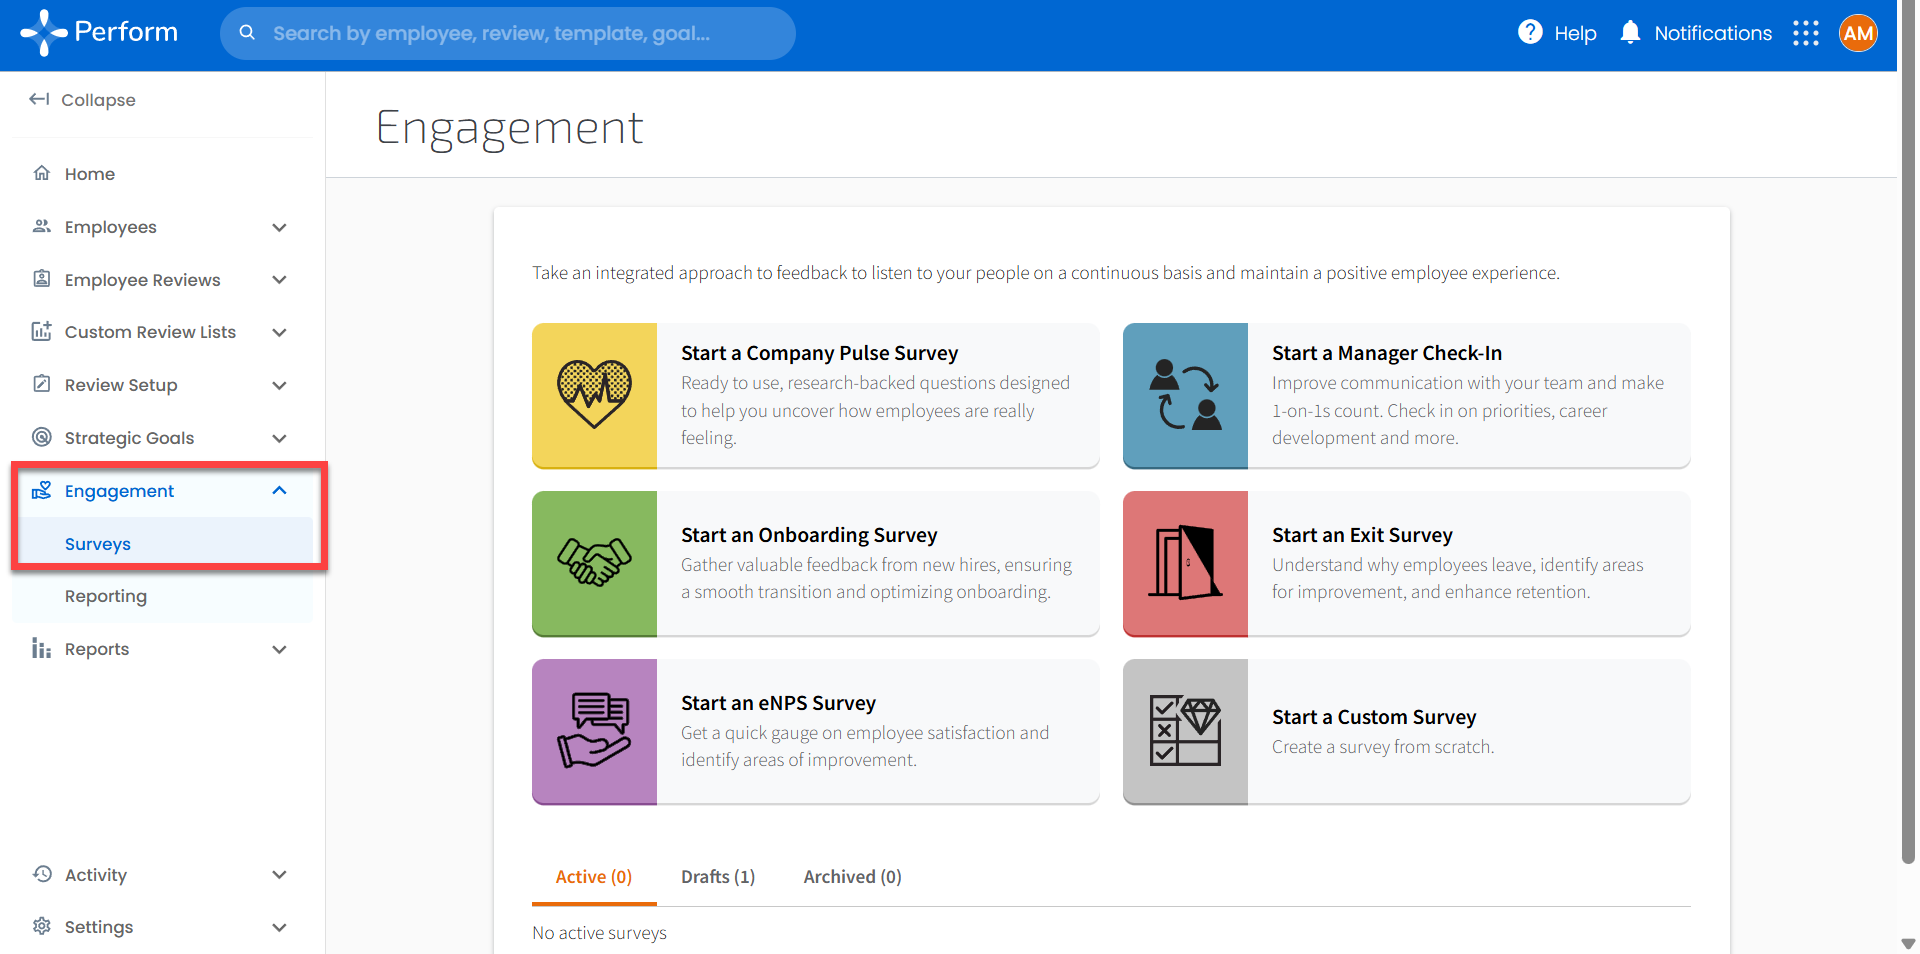
- Scroll down to your list of surveys.
- Click View Results next to the survey you want to review.


Understanding Survey Analytics
The survey analytics page is divided into two sections:
- Overview
- Individual Responses
Overview
The Overview section provides a high-level summary of your survey results.
Overall Survey Score
The survey score is an easy way to track the progress of surveys created from Trakstar templates.
The score:
- Calculates the average of all rating scale responses.
- Converts the results to a 0–100 scale.
- Makes it easier to compare results across surveys that use different rating scales.
- Provides a high-level view of employee engagement.
Question Responses
Scroll down to view each survey question along with the collected responses.
If comment responses were enabled for the survey, you'll also see a word cloud. The most frequently mentioned words appear in a larger font. Hover over any word to see how many times it was mentioned.

Individual Responses
The Individual Responses section lets you review responses submitted by each respondent.
From this section, you can:
- Filter the displayed responses.
- Select a specific employee to view all of their submitted answers.

Export Survey Data
To work with your survey data outside of Perform, click Export CSV in the upper-right corner of the page.
If you need to save the results as a PDF or image, we recommend taking a screenshot or using your browser's Print function to save the page as a PDF.
Filter Survey Results
You can filter survey responses by:
- Group (when applicable)
- Employee status
- Active
- Terminated