
Engagement Survey Reporting: Manager Check-In Usage
The Manager Check-In Usage dashboard helps administrators understand how Manager Check-In surveys are being used across the organization.
This reporting dashboard provides presentation-ready visualizations that highlight adoption, participation, and usage trends without displaying individual survey responses.
Use this dashboard to monitor Manager Check-In activity, identify engagement patterns, and better understand how managers are using the tool over time.
What You Can Learn
The Manager Check-In Usage dashboard provides insights into:
- Overall adoption of the Manager Check-In feature.
- Which managers are using Manager Check-Ins.
- How frequently Manager Check-In surveys are being sent.
- Usage trends over time.
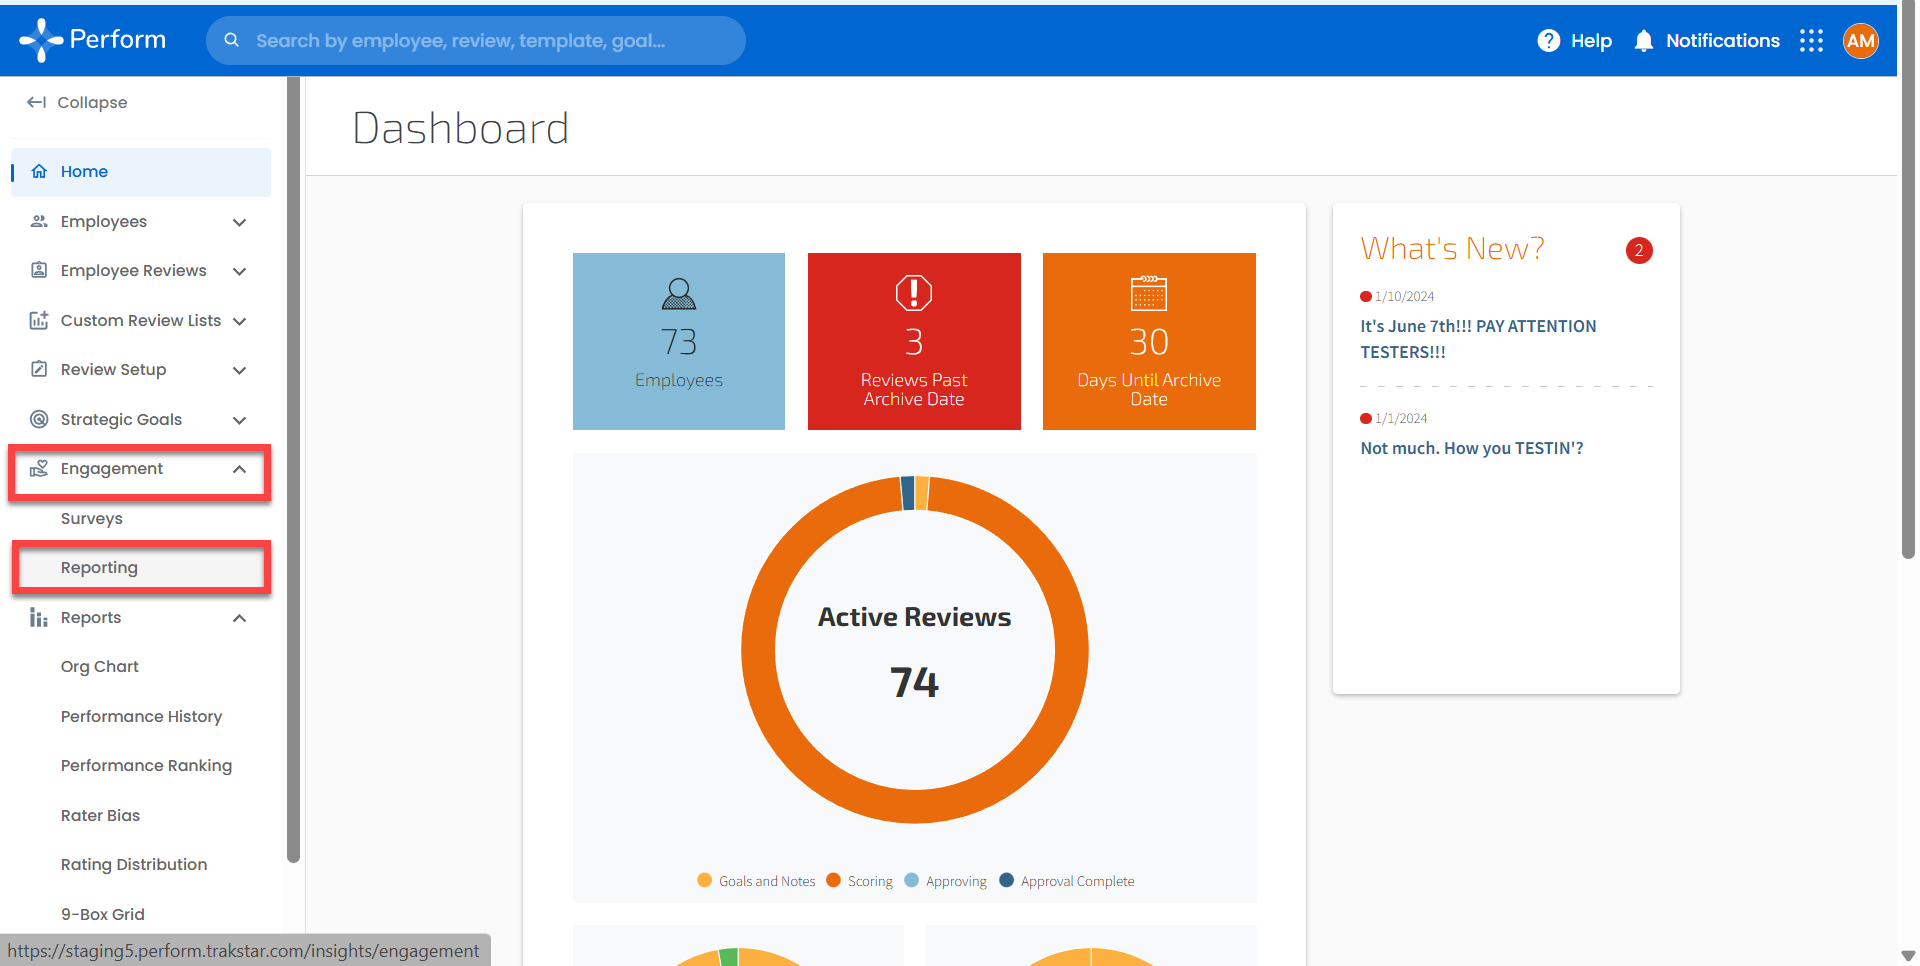
Access the Manager Check-In Usage Dashboard
- Sign in as an administrator.
- Navigate to Engagement.
- Select Reporting.
Engagement Feature Not Available?
If you do not see the Engagement tab, contact perform@trakstar.com for assistance enabling or troubleshooting the feature.
Reporting Dashboard Not Loading?
The first time you access an Engagement reporting dashboard, Trakstar Perform must generate your reporting environment.
This setup can take up to one hour.
If the dashboard is still unavailable after one hour, contact perform@trakstar.com
Note: The dashboard currently displays only managers who have at least one completed Manager Check-In survey or completed check-in.
Dashboard Filters
Use the filters at the top of the dashboard to refine the data displayed throughout the report.
Important: All dashboard filters apply globally. Changing a filter updates every visualization on the dashboard.
Survey Name
Select the Manager Check-In survey you want to analyze.
If no Manager Check-In surveys have been sent, this list will not contain any options.

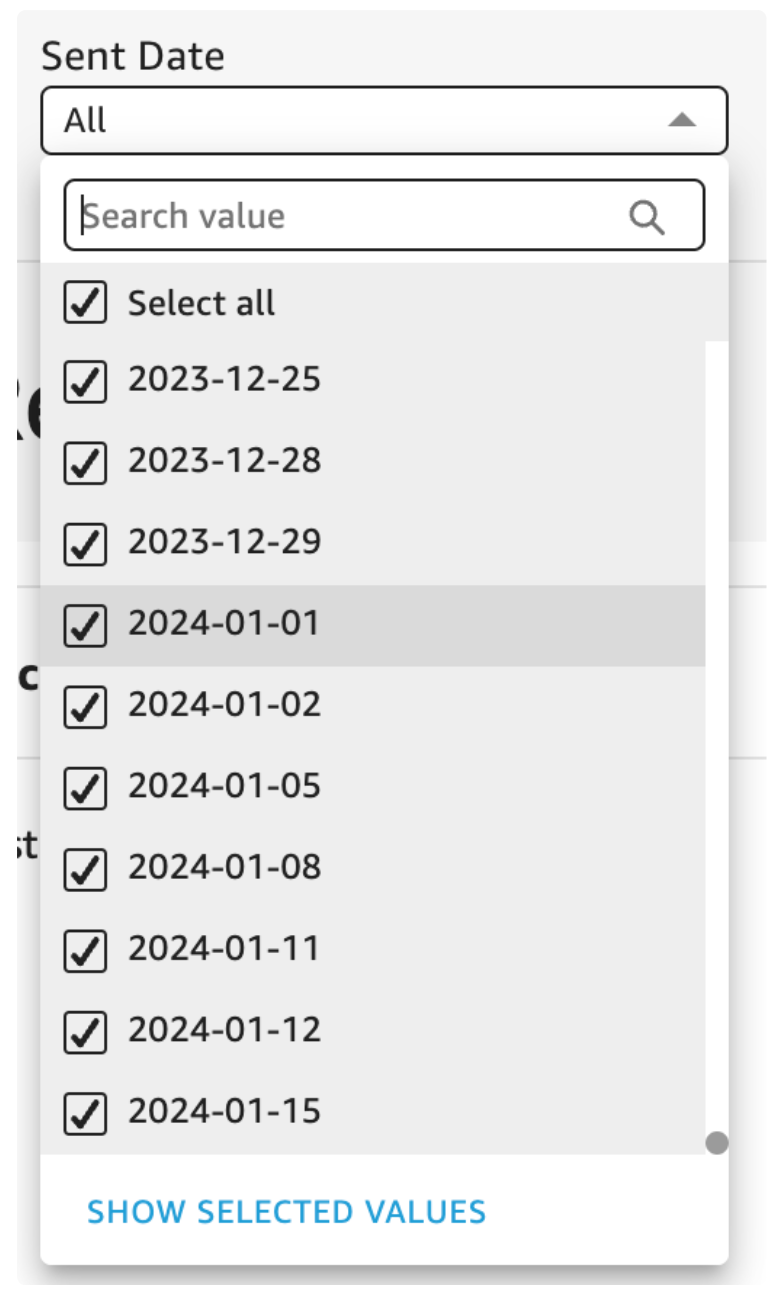
Sent Date
Filter results based on the date surveys were sent.
If the same survey has been distributed multiple times, you can:
- View a single distribution date.
- Include all survey distributions.
Note: Selecting a single distribution date causes trend charts to display only one data point.
Survey Status
Choose which surveys to include:
- Active
- Archived
- All (Active and Archived)
This filter affects the entire dashboard.

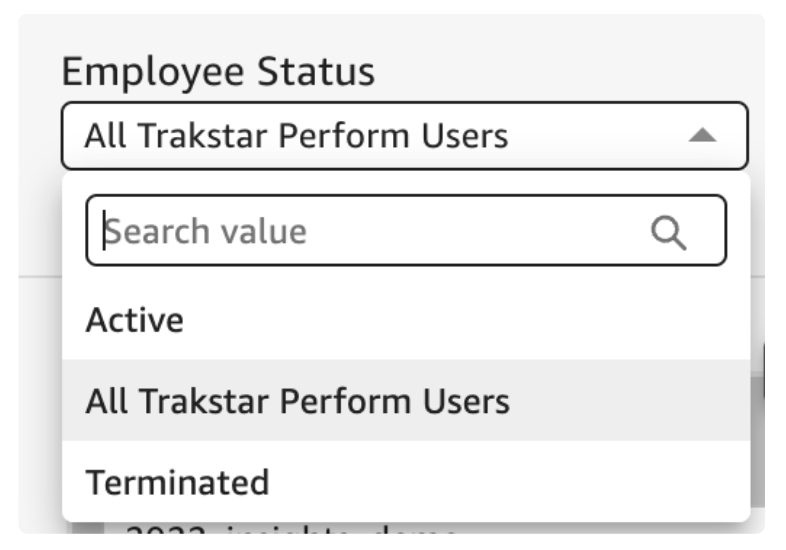
Employee Status
Filter the report to include:
- Active employees
- Terminated employees
- All Trakstar Perform users
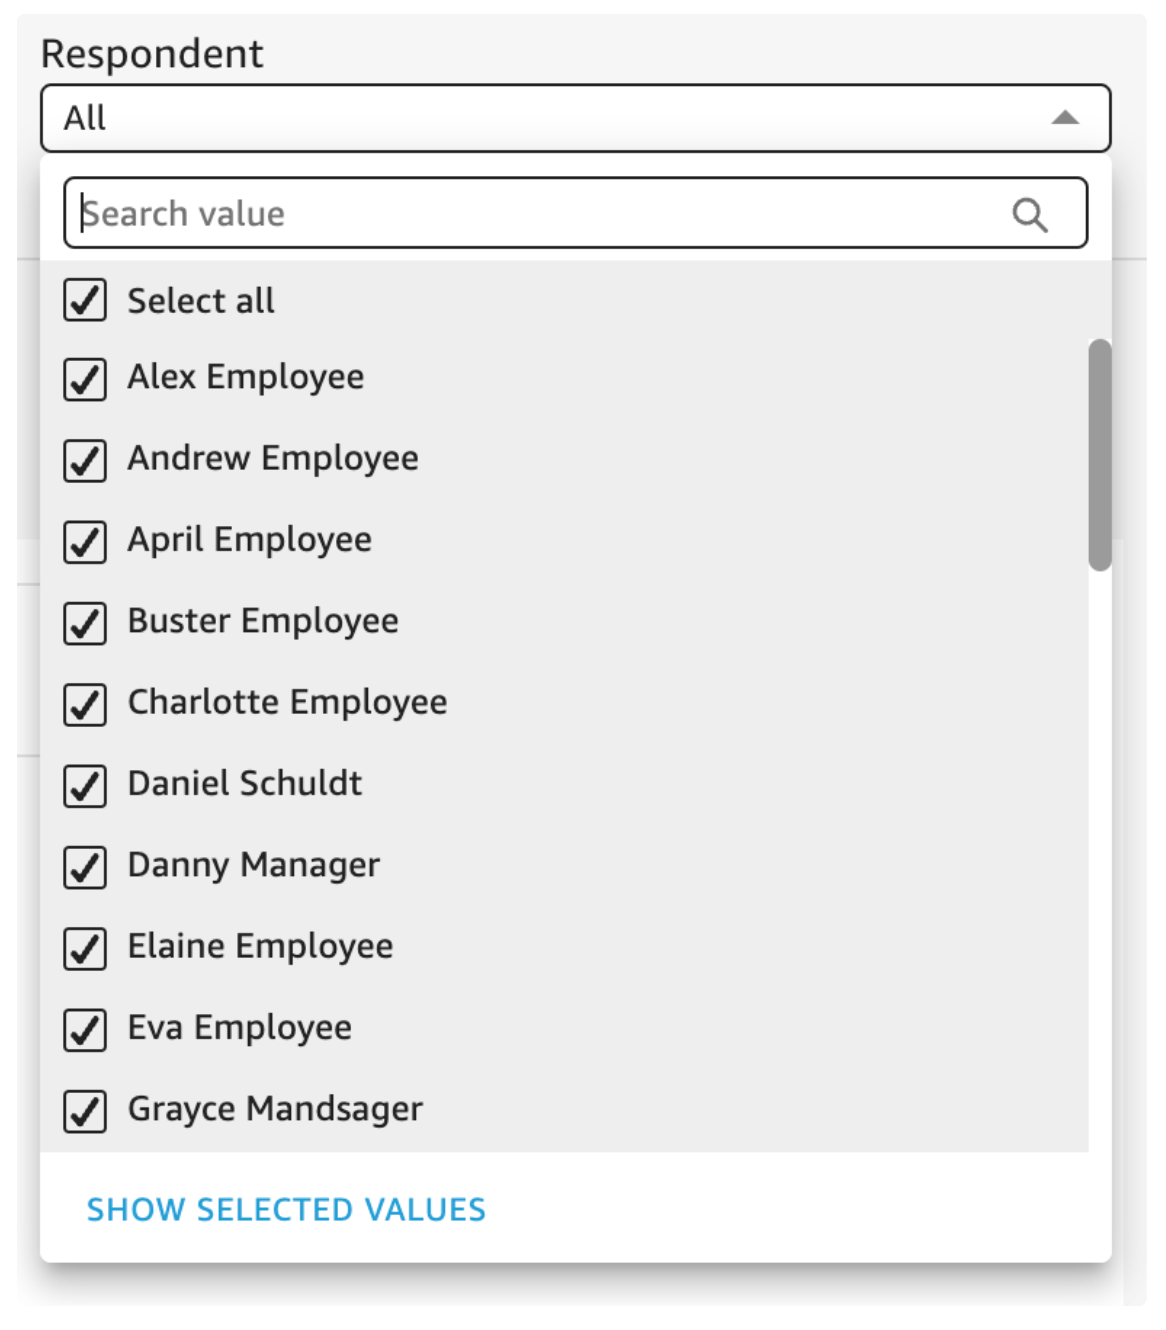
Respondent
Use this filter to display survey data for all employees or refine the report to specific respondents.
Survey Sent Date
The Sent Date filter allows you to select data from a specific date range.

Manager Name
Limit dashboard results to one or more selected managers.

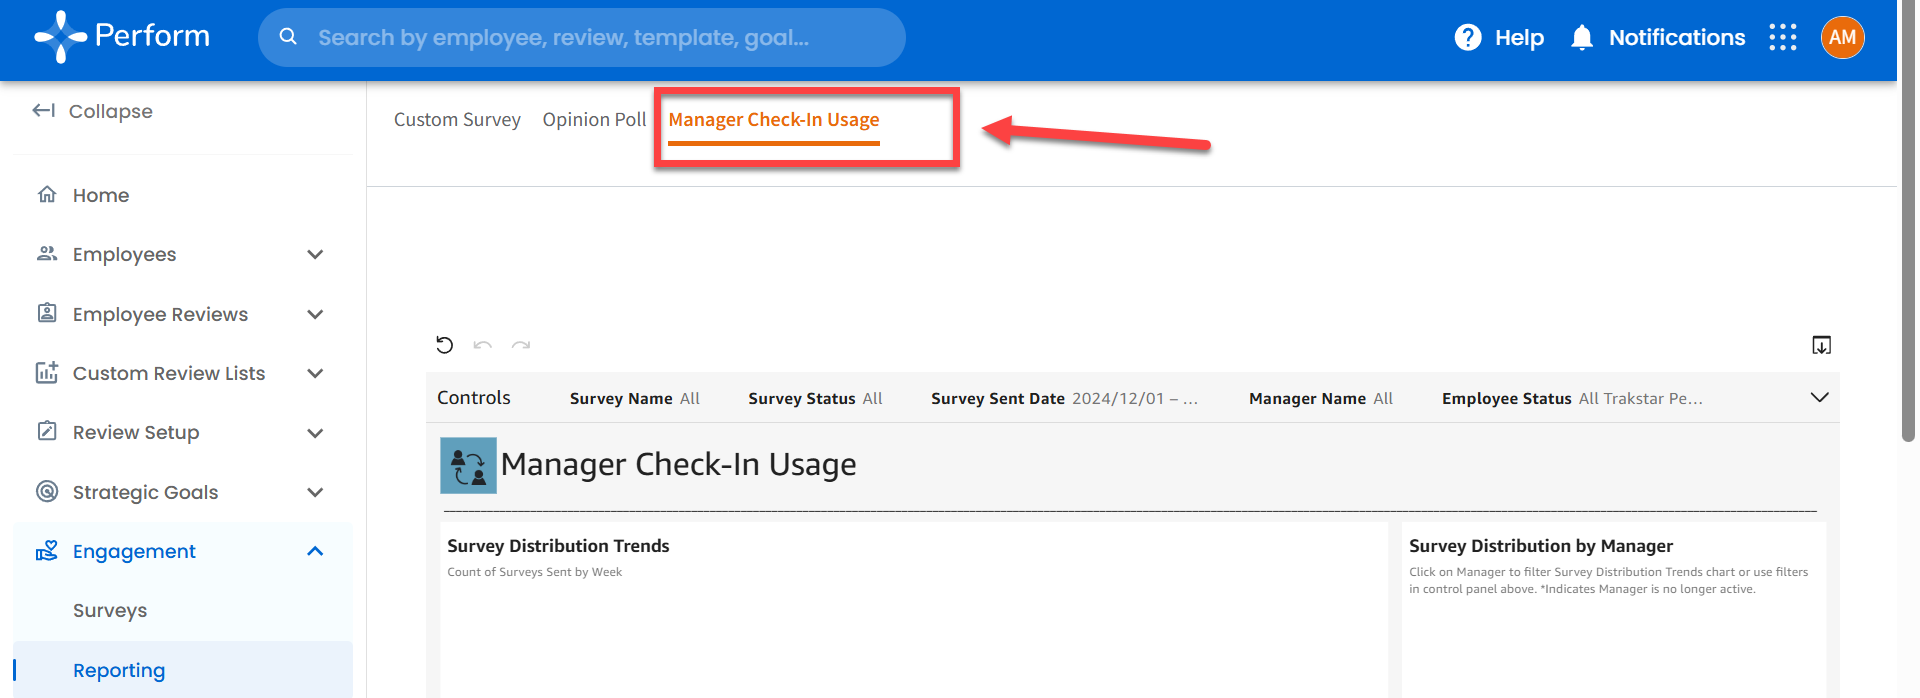
Dashboard Sections
Survey Distribution Trends
The Survey Distribution Trends chart displays the number of Manager Check-In surveys sent each week.
Hover over a bar to view the number of surveys distributed during the corresponding week.

Survey Distribution by Manager
This table summarizes Manager Check-In activity for each manager.
For every manager, the table displays:
- Total number of surveys sent.
- Dates surveys were distributed.
- Survey response rate.
Data bars provide a visual comparison of survey volume between managers.

Dates Sent
Displays the number of times each manager has distributed a Manager Check-In survey.
Response Rate
The response rate is calculated by dividing the number of completed survey responses by the number of surveys sent.
Filter by Manager
Select a manager's name within the table to filter the Survey Distribution Trends chart for that manager only.
Export the Table
The table can be exported in either:
- CSV format
- Excel format
This allows you to perform additional analysis outside of Trakstar Perform.
Manager and Respondent Survey Counts
This table provides detailed survey activity organized by both manager and respondent.
Available information includes:
- Manager name
- Respondent name
- Number of surveys sent
- Number of responses received
- Response rate
- Survey status
- Survey description
This view provides additional insight into Manager Check-In participation across the organization.

Find more features below!
Print the Dashboard
Most dashboard visualizations can be printed using your computer's print functionality.
You can also choose Print to PDF to save the dashboard as a PDF file.
Note: The full scoreable table cannot be printed.
Export Dashboard Data
Many dashboard tables support exporting for additional analysis.
To export a table:
- Hover near the upper-right corner of the table.
- Select the three-dot menu.
- Choose either:
- Export to CSV
- Export to Excel

Collapse or Expand the Control Panel
The dashboard control panel is always available at the top of the page.
Select the arrow in the upper-right corner to:
- Expand the control panel.
- Collapse the control panel.


If a survey has been configured as anonymous, dashboard filters display only options with five or more survey responses.
This threshold helps protect respondent confidentiality by preventing identification of individual responses.
Questions? We're here to help! Reach out to us at perform@trakstar.com!